
Founded in 2010 · 16 years of software and system development Software and system development experts
16 years of expertise · 3000+ digital transformation partners

Data Visualization Platform DevelopmentIndustry Digital Solution

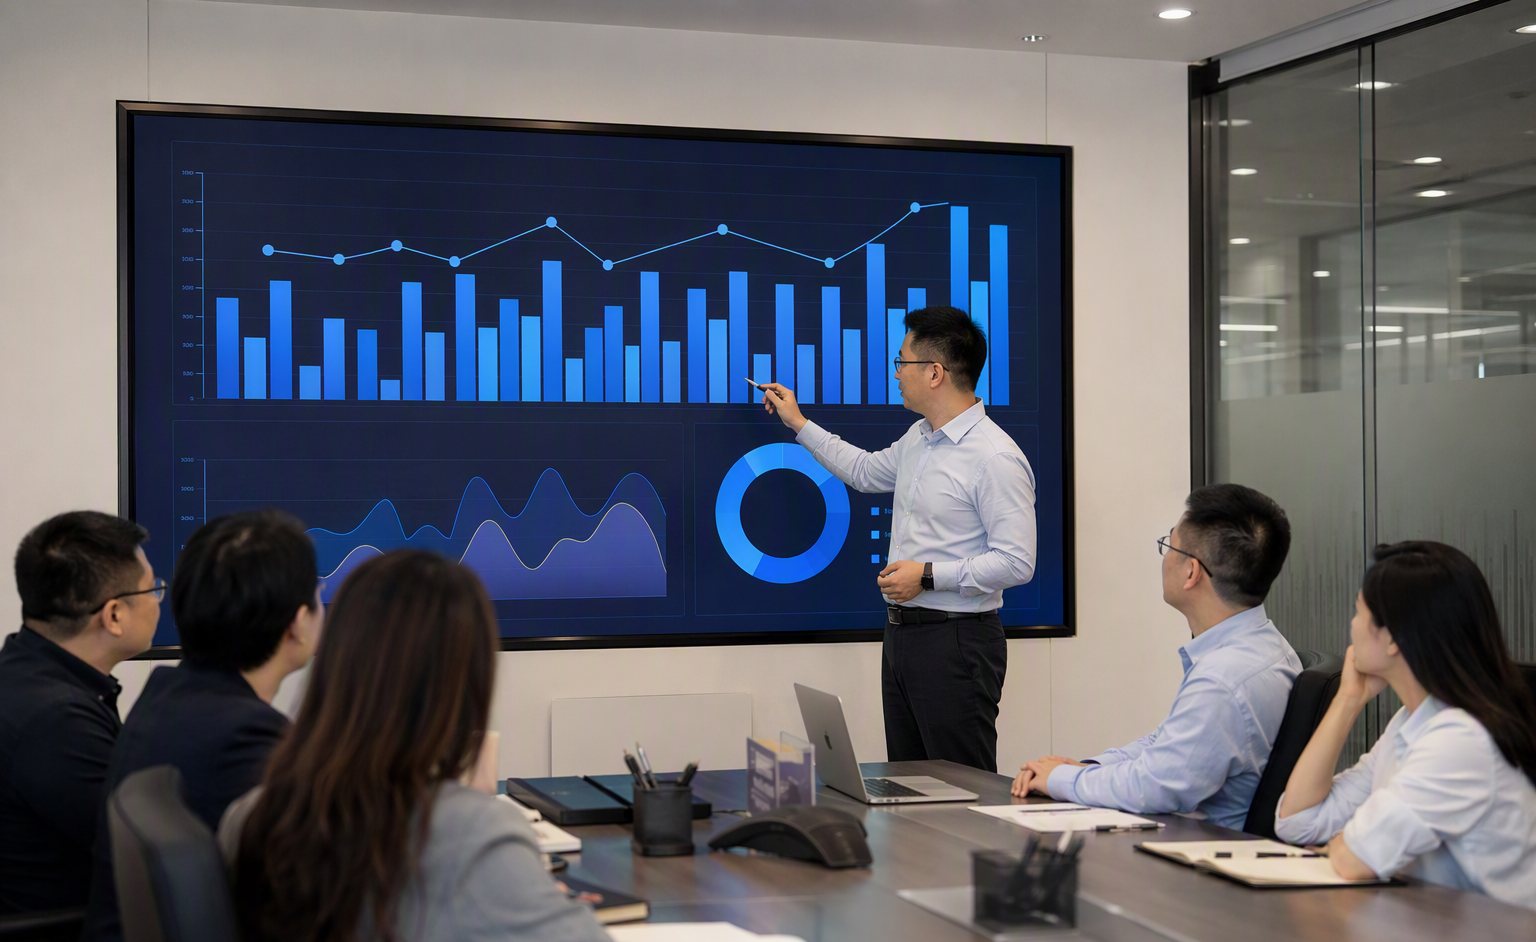
Turning business data scattered across systems into intuitive large screens and dashboards: real-time metrics, trend alerts, and drill-down analysis, enabling management to see the whole picture on one screen and spot anomalies in a second.

Real-time
Data refresh from days to minutes
80%
Less effort spent on business analysis
3 Platforms
Full coverage across large screens/PC/mobile
Data Visualization Platform Development
✓

One year of free warranty

100% of system data belongs to the client

Solution Overview

Turning business data scattered across systems into intuitive large screens and dashboards: real-time metrics, trend alerts, and drill-down analysis, enabling management to see the whole picture on one screen and spot anomalies in a second.

Functional modules 6 core modules
Use cases 4 typical scenarios
Key metrics 3 quantified outcomes
CHALLENGES · Industry Pain Points

Do These Scenarios Sound Familiar?

Data scattered across a dozen systems; business reviews rely on manually built PPTs
Reports lag by a week or more, so decisions are always half a step behind
Dashboards are just for show—data isn't real-time and can't be drilled into
Every level and role sees the same metrics, with no tiered views
Real-timeData refresh from days to minutes
80%Less effort spent on business analysis
3 PlatformsFull coverage across large screens/PC/mobile
MODULES · Functional Modules

Core Modules of a Data Visualization Platform

01Large-Screen VisualizationCommand center large screens, 3D maps, real-time data stream rendering
02Business CockpitPC and mobile management cockpits with core metrics at a glance
03Self-Service ReportsDrag-and-drop report designer for business users to retrieve data themselves
04Alert CenterMetric threshold alerts with automatic push of anomalies to owners
05Data IntegrationConnects to ERP/CRM/MES and other systems, plus Excel and databases
06Tiered PermissionsGroup—business unit—store three-level views with data masking
SCENARIOS · Typical Use Cases

This Solution Is Running in These Scenarios

Group Business Command CenterSmart City Operations DashboardReal-Time Chain Store ReportsProduction Workshop Andon Board

Suitable For

SUITABLE FOR Industries and business scenarios These organizations can adopt this proven solution first
Group enterprise headquartersGovernment command centersPark operatorsChain brands

Ready to put Data Visualization Platform Development to work?

Deliver the full solution or tailor it module by module. A free assessment includes a recommended approach and price range within 48 hours.